Analytics, Business Intelligence and Big Data – What’s the difference?
In the business and scientific domain, most organizations differentiate between four different forms of pattern identification in data sets:
- Data analysis
- Analytics
- Business Intelligence (BI)
- Big Data
Although all four definitions are closely related, there are some subtle differences between the terms that have an impact for the design of Big Data solutions.
Data analysis
Data analysis is a process of inspecting, cleansing, transforming, and modeling data with the goal of discovering useful information, suggesting conclusions, and supporting decision-making. Data analysis has multiple facets and approaches, encompassing diverse techniques under a variety of names, in different business, science, and social science domains.
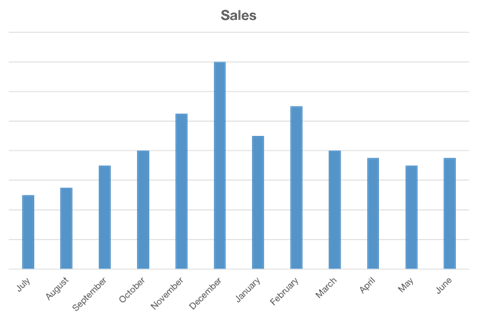
Data analysis – in the literal sense – has been around for centuries. The primary purpose of data analysis is to review existing data in order to describe patterns that have happened in the past. It is therefore also frequently referred to as descriptive data analysis. An example of data analysis would be to review the sales patterns of different stores over the past years.

Analytics
Analytics is the discovery, interpretation, and communication of meaningful patterns in data. Especially valuable in areas rich with recorded information, analytics relies on the simultaneous application of statistics, computer programming and operations research to quantify performance.
Analytics encompasses a growing field of data science capabilities including statistics, mathematics, machine learning, predictive modeling, data mining, cognitive computing and artificial intelligence.
There are four categories of analytics that organizations need to consider:
-
Descriptive analytics:
Descriptive analytics or data mining are at the bottom of the big data value chain, but they can be valuable for uncovering patterns that offer insight. A simple example of descriptive analytics would be reviewing the number of people that visited the company’s website over the past few months. Descriptive analytics can be useful in the sales cycle, for example, in order to spot seasonal trends and to adjust purchasing decisions accordingly.
- Diagnostic analytics: Diagnostic analytics are used for discovery or to determine why something happened. In a social media marketing campaign for example, diagnostic analytics can be used to determine why certain advertisements resulted in increased conversion rates. Diagnostic analytics provide valuable insights for organizations, because it helps them understand which decisions impact the company’s performance.
- Predictive analytics: Predictive analytics use Big Data to identify past patterns to predict the future. From trends or patterns in existing data sets, predictive algorithms calculate the probability that a certain event will occur. For example, some companies are using predictive analytics for sales lead scoring, indicating which incoming sales leads will have the highest chance of converting into an actual customer. Properly tuned predictive analytics can be used to support sales, marketing, or for other types of complex forecasts.
- Prescriptive analytics: Prescriptive analytics is the last and most valuable level of analytics. While Big Data analytics in general sheds light on a subject, prescriptive analytics gives you a laser-like focus to answer specific questions. For example, in the health care industry, you can better manage the patient population by using prescriptive analytics to measure the number of patients who are clinically obese, then add filters for factors like diabetes and LDL cholesterol levels to determine where to focus treatment. The same prescriptive model can be applied to almost any industry target group or problem.
Whereas data analysis aims to support decision-making by reviewing past data (i.e., descriptive or diagnostic analytics), analytics in the context of Big Data is primarily concerned with optimizing the future (i.e., predictive or prescriptive analytics). For this purpose, analytics makes use of (complex) algorithms to find patterns in data in order to provide advice on the best possible course of action for an organization (i.e., recommendations). An example of a popular and widely used analytics tool is Google Analytics that organizations can use to predict website traffic and optimize online advertisements.

Business Intelligence
Business Intelligence (BI) comprises of the strategies and technologies used by enterprises for the data analysis of business information. Business Intelligence uses both data analysis and analytics techniques to consolidate and summarize information that is specifically useful in an enterprise context.
The key challenge with Business Intelligence is to consolidate the different enterprise information systems and data sources into a single integrated data warehouse on which analysis or analytics operations can be performed. A data warehouse is a (large) centralized database in an organization that combines a variety of different databases from different sources. An example of Business Intelligence would be to build a management dashboard that visualizes key enterprise KPIs across different division in the world.

Big Data
As discussed in our previous post on Big Data characteristics, Big Data four key properties ― the four V’s. Big Data makes use of both data analysis and analytics techniques and frequently builds upon the data in enterprise data warehouses (as used in BI). As such, it can be considered the ‘next step’ in the evolution of Business Intelligence.
Big Data, however, requires a different approach than Business Intelligence for a number of key reasons.
The data that is analyzed in Big Data environments is larger than what most traditional BI solutions can cope with, and therefore requires distinct and distributed storage and processing solutions.
Big Data is characterized by the variety of its data sources and includes unstructured or semi-structured data. Big Data solutions need, for example, to be able to process images of audio files.
The difference between Big Data and Business Intelligence can be depicted by the figure below:

This picture provides a very high-level overview of Big Data solutions. The technical structure and architecture of Big Data environments will be further discussed in a separate post.
Share this article
Written by : Big Data Framework
Official account of the Enterprise Big Data Framework Alliance.


